Oversold across the board: what the charts are telling grain buyers and sellers
Wheat, corn and the soy complex have all slid together since September. Has the selling gone far enough and fast enough that buyers should consider further cover and sellers should think twice before chasing the market lower?
Summary
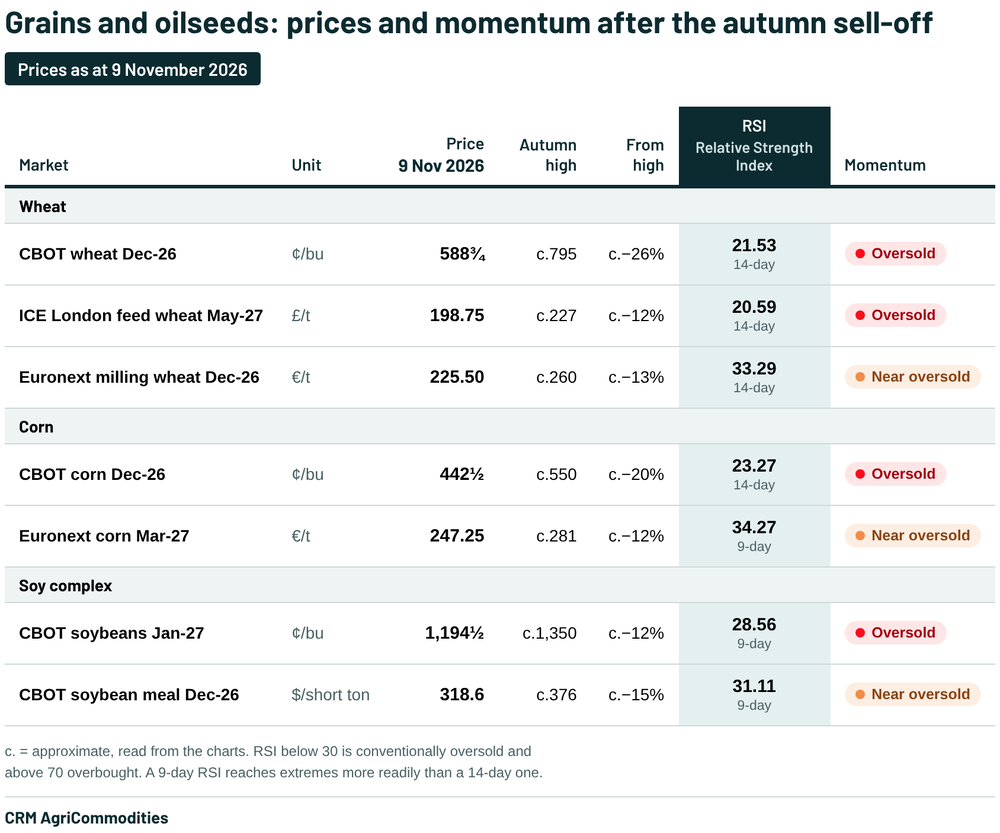
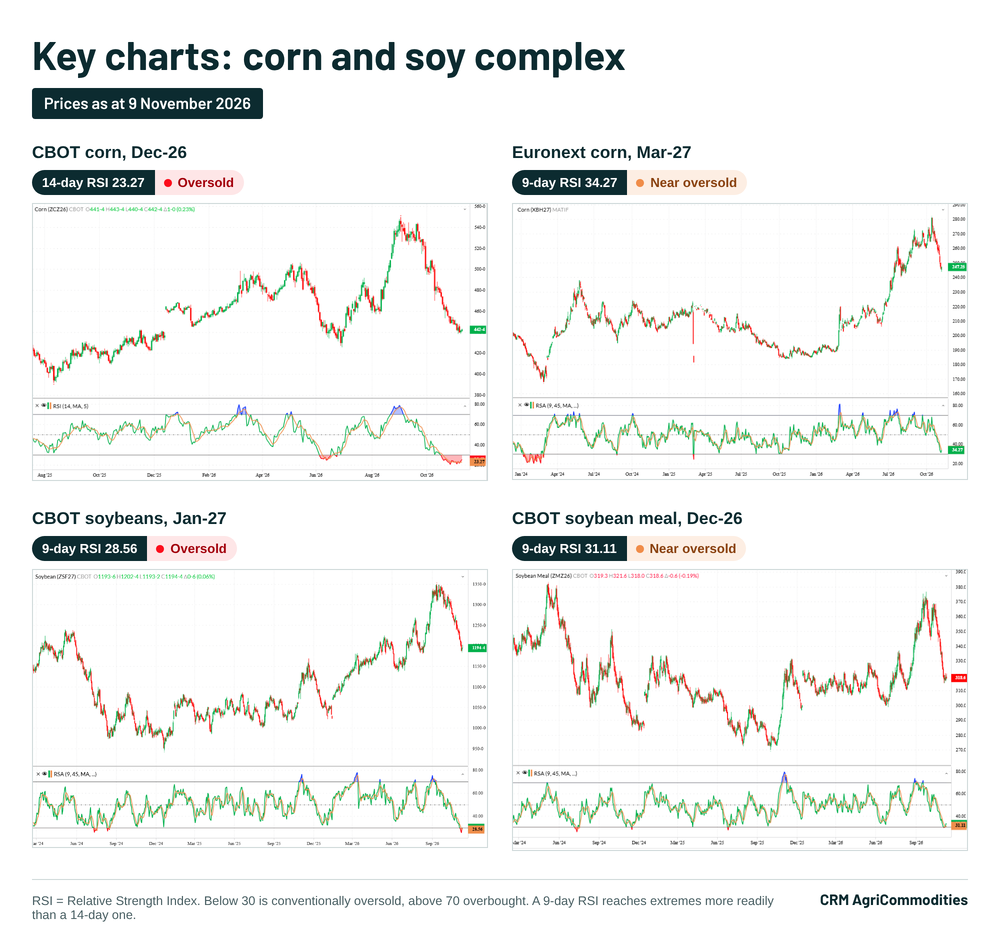
Downside momentum across grains and oilseeds is now stretched. Four of the seven contracts on our key charts have a Relative Strength Index (RSI) below 30, the usual oversold line. The other three are in the low 30s.
That does not mean prices have bottomed. It does mean the sell-off is mature, the risk of a sharp short-covering bounce is rising, and selling into this weakness offers little reward. For buyers, the charts warrant building cover in stages rather than waiting for a perfect low. For sellers, they highlight patience, and using a bounce rather than this weakness to price grain.
Indiscriminate, not individual
What stands out is how many markets are falling, not any single one. Chicago and Paris wheat, London feed wheat, Chicago and Paris corn, soybeans and soymeal all peaked between early September and mid-October. They have fallen together since, even though each has its own supply and demand story.
When unrelated markets move in step this sharply, the cause is usually positioning and money flows rather than one fundamental shock. Typical drivers are speculators selling long positions, trend-following funds switching to short, and stop-losses being triggered as has been seen in fund positions recently.
What RSI is, and what it isn’t
J. Welles Wilder introduced the RSI in 1978. It compares the average size of up-days with the average size of down-days over a set period, 14 sessions by default, and scales the result between 0 and 100:
RSI = 100 − [100 ÷ (1 + average gain ÷ average loss)]
A reading above 70 is usually called overbought, below 30 oversold, and 50 is neutral. Four points matter for using it well.
First, it measures momentum, not value. An RSI of 21.53 on Chicago wheat says the market has fallen fast, with few up-days along the way. It says nothing about whether $5.89/bu is cheap given supply and demand.
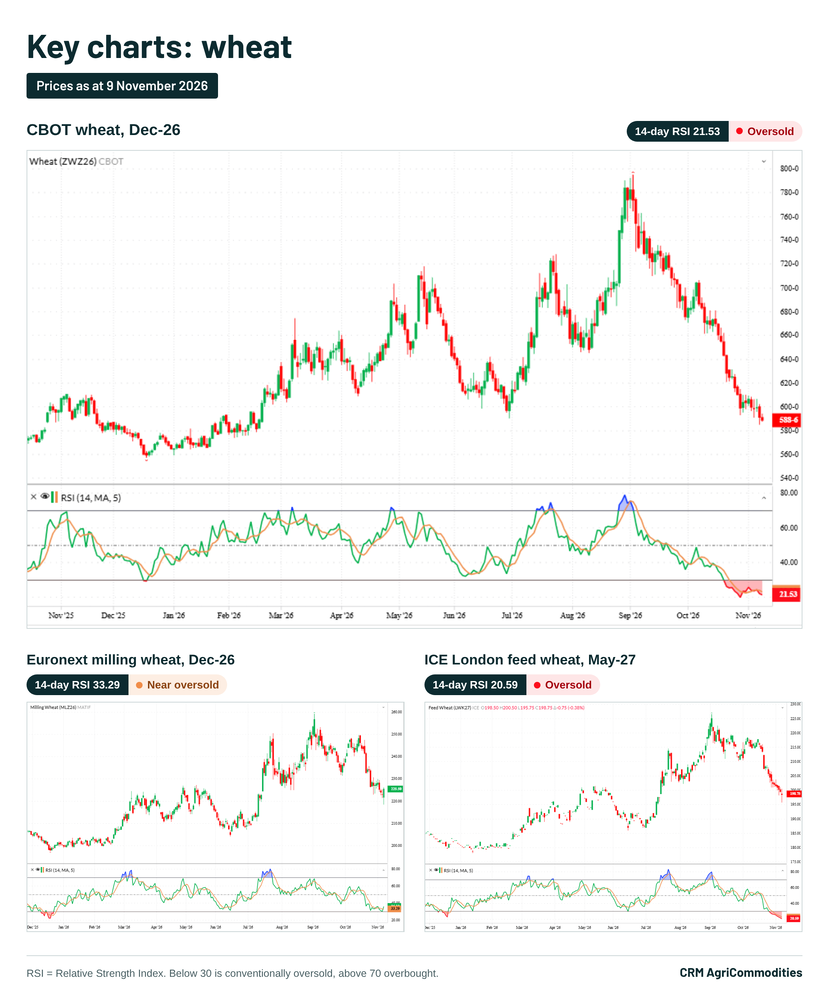
Second, an oversold market can stay oversold. In a strong trend, RSI can sit below 30 for weeks. Chicago wheat’s has been below 30 since late October. In downtrends, RSI tends to move in a lower range of roughly 20 to 60. So a bounce that stalls around 50–60 is itself a sign the downtrend is still in place.
Third, the useful signals come after the extreme, not at it. Watch for three things:
- RSI climbing back above 30.
- A bullish divergence, where price makes a new low but RSI makes a higher low.
- RSI crossing above its own moving average, the orange line on our charts.
There are early hints in two markets. Paris wheat closed at €225.50 after trading below €220 in the same session, and its RSI has ticked up from 30. Soymeal’s RSI is also turning up from 30. Neither confirms a turn yet.
Our charts show both ends of the indicator at work this year. Chicago wheat’s RSI touched 30 at the late-December 2025 low, just before the spring rally. It peaked near 80, its most overbought reading of the year, at the early-September high. Earlier overbought readings in spring and July were followed by falls of very different sizes. RSI shows that a market is stretched; it does not tell you how far the reversal will run.
What it means for buyers
For buyers with open requirements (including mills, government purchasers, livestock farmers), the case for taking some cover is now at its strongest. With momentum stretched, any further fall is likely to come more slowly. The risk of a sharp bounce, as short sellers buy back, is greater than it was a month ago.
RSI cannot pick the exact low, so the practical approach is to view oversold markets as a chance to consider requirements.
What it means for sellers
For growers with unpriced grain, an oversold market is usually a poor place to sell. It means selling after the fall rather than before it. Where storage, cash flow and quality allow, the charts argue for patience rather than chasing the market lower.
The caveat is not to mistake a bounce for a turn. A recovery from oversold levels can be short-lived if fundamentals stay heavy, although our view is that they are not heavy, especially without a Black Sea agreement.
UK and European read-across
For UK growers, London feed wheat has fallen around 12%, much less than Chicago. Yet at 20.59 its RSI is the lowest since December 2025. Its decline has been steady with very few up-days, so UK momentum is as stretched as anywhere.
Oilseed rape has bucked the trend, with price sharply lower from overbought levels which we flagged in October highlighting how useful an understanding of the RSI can be.
What to watch
Signs of a technical turn. RSIs climbing back above 30, and any bullish divergence between price and RSI.
Fund positioning. The weekly CFTC Commitments of Traders report, published on Fridays with positions as at Tuesday, will show whether speculative funds now hold a large net short position. That would support the fund-selling explanation. It would also mean more short positions that could be bought back, adding fuel to any rally.
Fundamentals that could confirm or override the charts. Price action is not fully reflecting fundamentals in a number of markets, this can open the way for volatility as prices and fundamentals realign.